This is the first part of a new project, more details to be released later…
tr(uSDX)
Martin is a licensed radio amateur who enjoys building things. He was recently part of a UK group buy for a radio kit. The tr(uSDX) the radio is really tiny and can operate on five bands.
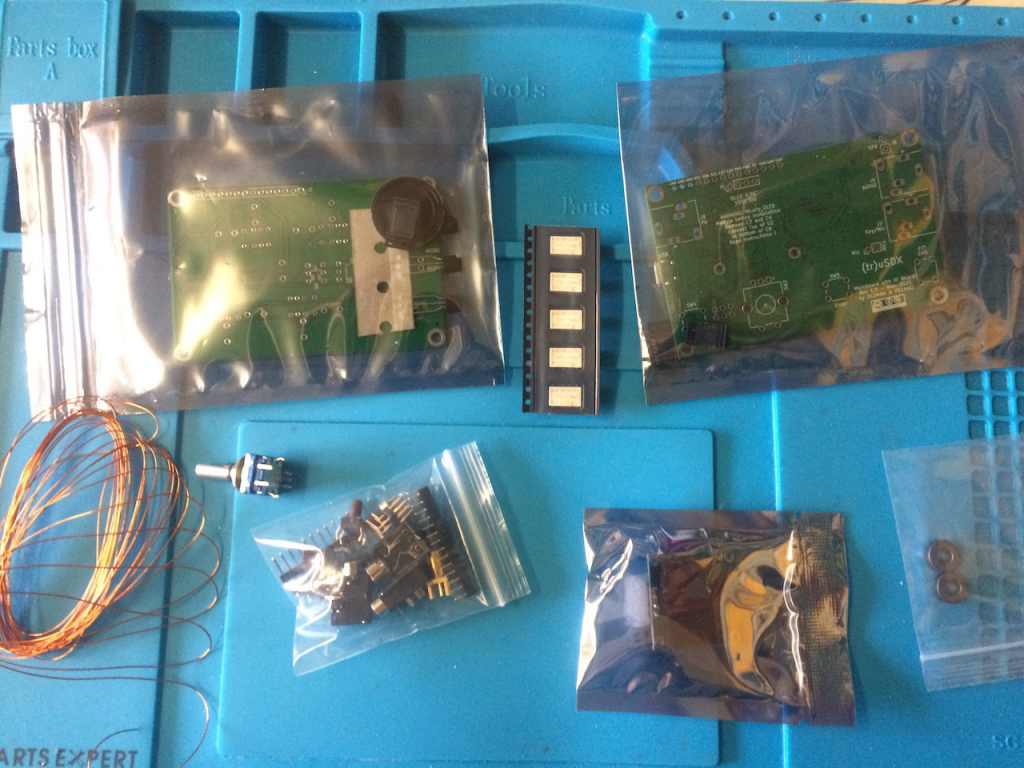
tr(uSDX) kit
The main SMD parts were pre-soldered although Martin did have to solder on a couple of SMD parts, that had been sourced separately to the original PCB production. Other parts soldered on included all the connections and filter toroids. The whole build took a couple of hours. Once finished it was housed in a case the Phil had 3D printed.
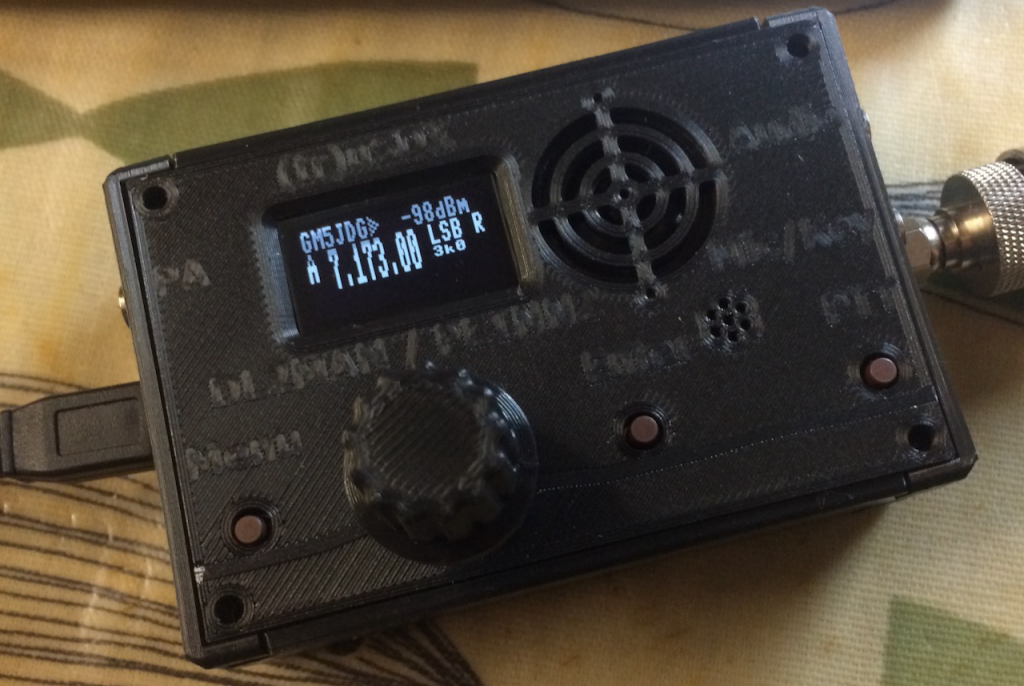
3d Print3d housing
The radio works well and puts out around five watts. One annoying issue though is the speaker, it’s very small and the audio quality it produces is not very good. One solution is to connect either headphones or a powered speaker to the Audio out socket.
Amplifier
Martin purchased a small powered speaker from Amazon but it produced horrendous interference with the radio. He thought “why not build my own!” He’s part of a group aligned to the GQRP club who are building a scratch built radio transceiver, part of the build is an audio amplifier based on an LM380 chip.
Design
The design from the ‘scratch built’ group includes a pre-amp. Martin decided that he wouldn’t need this as the signal source was reasonably amplified already, and wondered if the LM380 was the right chip to use as it’s been around a long time. Researching the other solutions, including LM386, can be noisy and a little underpowered, TDA2003, used in many car audio systems and seems to offer similar performance to LM380.
Martin eventually decided to stick with the LM380 as he had built a circuit using it before and there were a number of similar designs found on the internet in use by other radio amateurs.
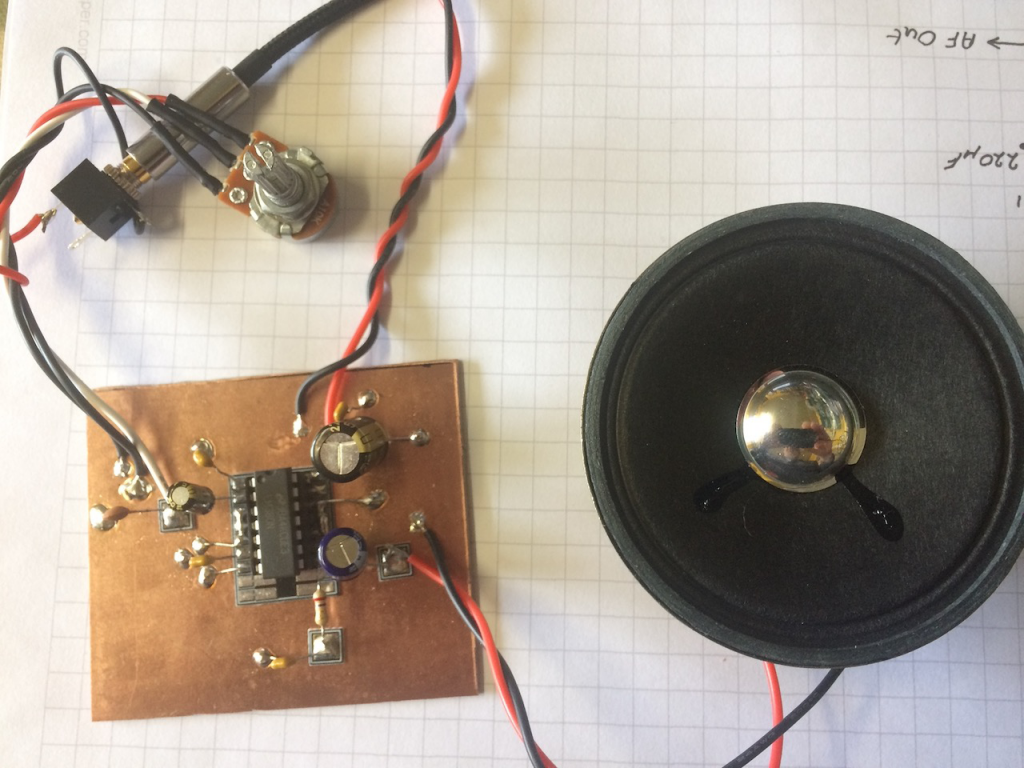
One design difference Martin made to the scratch built design was to use 100uF coupling capacitor to the speaker as this acts to roll off some of the audio frequency below 300Hz. The amplifier will primarily be used with speech in the range 300Hz – 3kHz. Additional capacitors were added to increase noise immunity from RF sources and reduce hum, particularly on the signal input. Supply voltage can be anything from 9-15V. I decided to use a 3” 8ohm speaker for output.
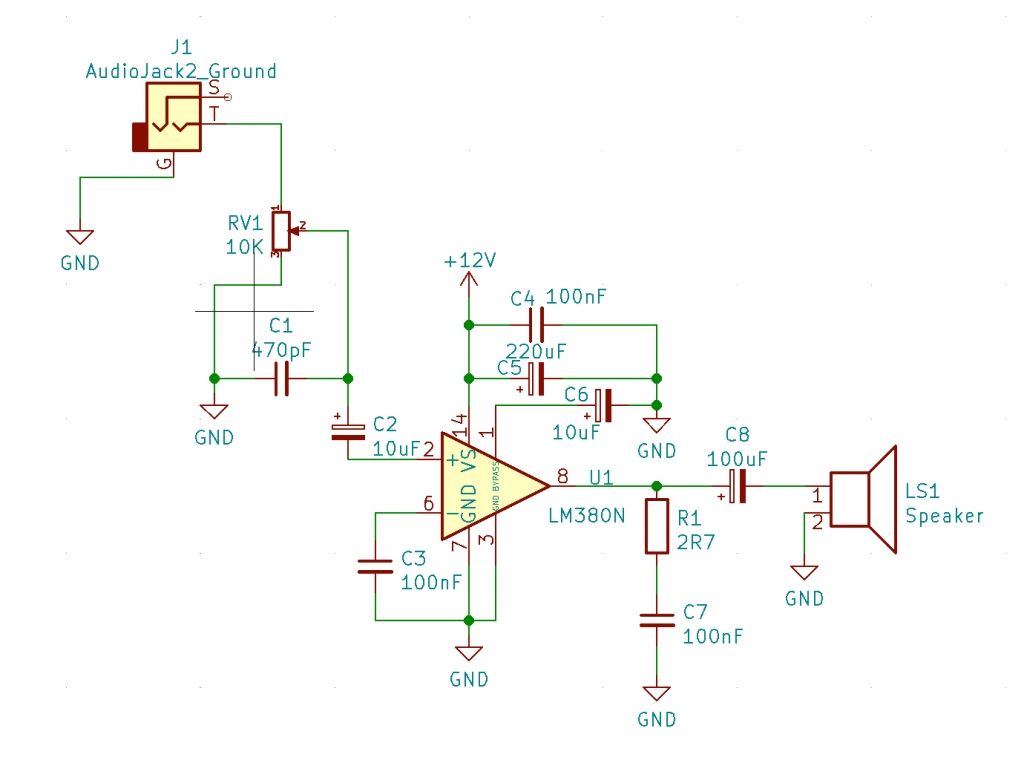
KiCad
Martin’s final design was drawn up in KiCad
Building
Using the Manhattan construction approach to building the design. Martin says he “finds it easiest to use prefabricated joining square called MeSquares for the build, these are also available from GQRP, for members, or a similar product is available from Kanga Products“
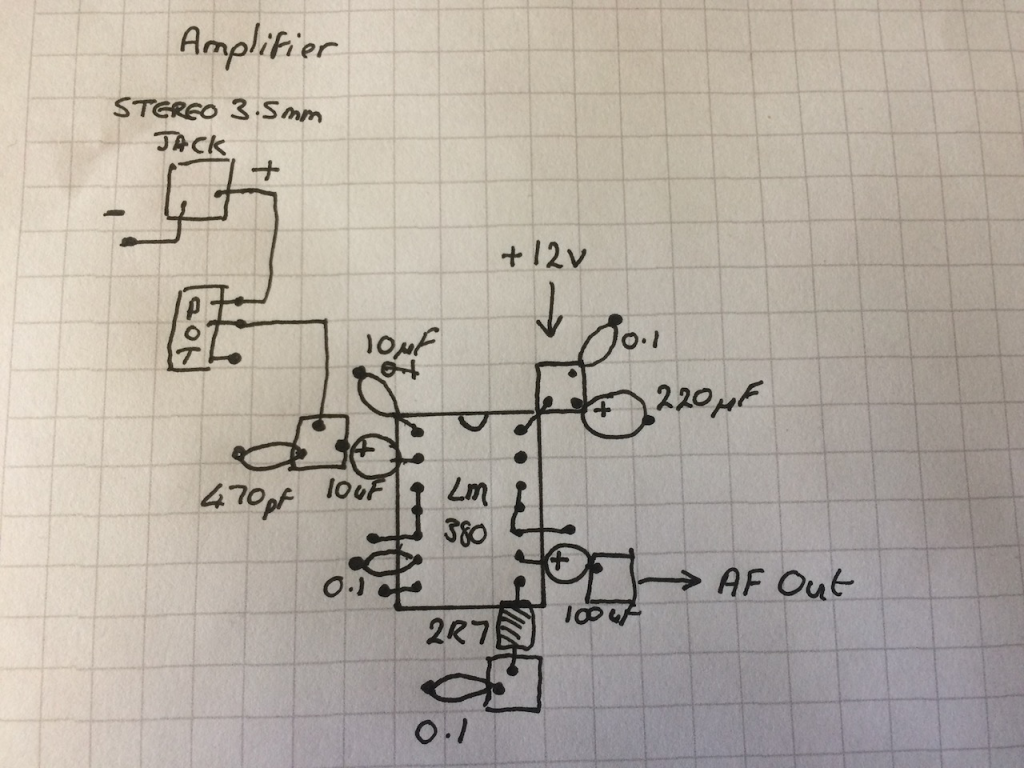
The first step was to layout the design on 1/4” graph paper.
Initial circuit design on paper by Martin Evans
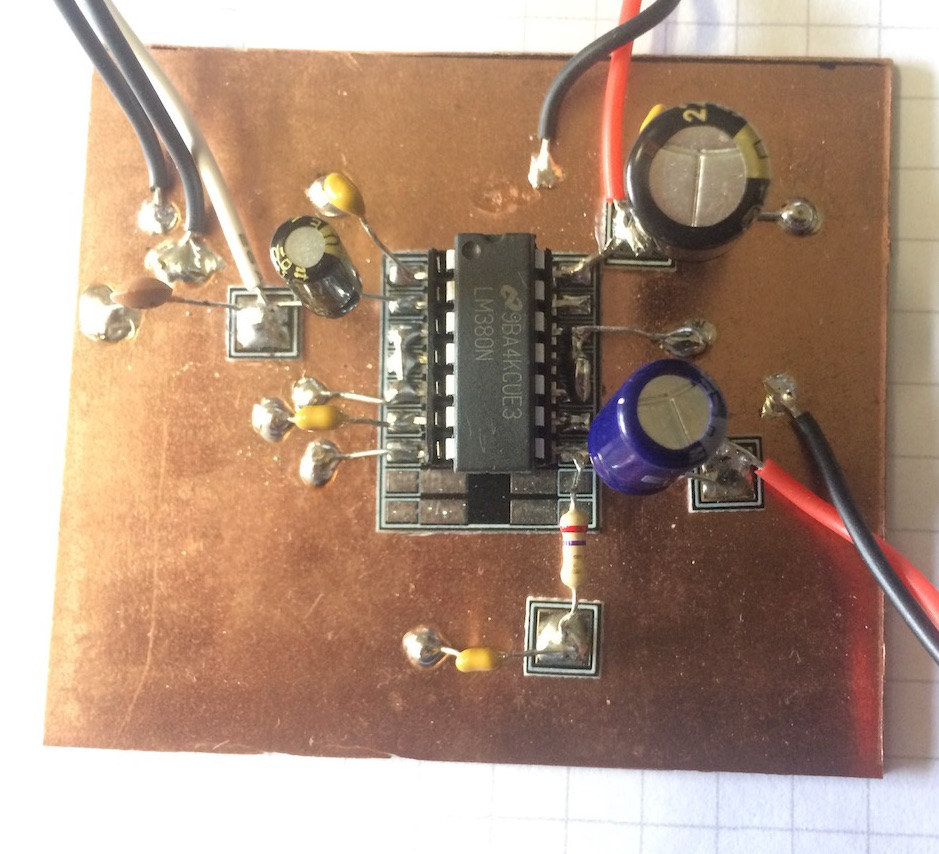
Then the parts were soldered to the single sided PCB. The squares were glued into place with super glue.
1st prototype
The final stage was to test it. Martin tested it using the output from the tr(uSDX) transceiver. The results were very favourable.
Video of the prototype in action
The LM380 runs a little hot so Martin will add some additional heat sinking to the pins 3,4,5 and 10,11,12 as detailed in the data sheet additionally the sound could be improved by mounting the speaker into a small wooden box.
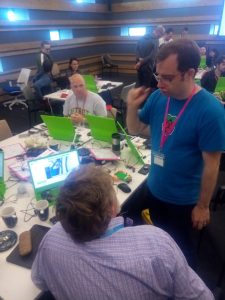
Early in June, Digital Maker CIC’s Martin & Phil both attended the amazing Raspberry Pi #Picademy – a two day event, training digital makers / teachers / educators.
The first day gave the attendants insight into several GPIO (General Purpose Input/output) devices & addons for the Raspberry Pi and a great intro into the music making program “SonicPi”. Short presentations were given, with step by step guides for the participants to follow. We started with the classic “blinking LED” attached to the GPIO Pins, using python to program the LED. We moved on to using a “sense hat” and “explore hat”, devices that plug into the GPIO pins of the Raspberry Pi, and contain sensors or motor controllers etc. Again, short “step by step” introductions to the devices, how to use them and how to program them in python were given, with “playtime” of about 20 minutes to see what the participants could come up with.
We were also asked to participate in visualisations of how a breadboard works (how electricity flows through the board, wires, resistors and LEDs). We ended the day with a short “lets make something from the junk box and motor controllers” – with a mad dash to make something fun & eye catching with cardboard tubes, pipe cleaners and “bits n bobs”.
Day 2 was set for a full day of working in teams to use what we had learned in day one, but “bigger & better”, mixing up various inputs & outputs.
Martin had been looking forward to working on an OpenCV project he’d started, and our team worked n making a wheeled robot that could detect “traffic lights” (green = go!, red = stop!). We succeeded much to the surprise of some people’s experience of using OpenCV previously (in such a short space of time).
It was a really exciting, challenging & fun day, and overall experience. A room full of intrepid makers & educators, playing with the Pi & Kit, all making interesting “inventions”, which ultimately stimulated problem solving, creativity and communication (of ideas / progress etc).
Digital Maker CIC were really chuffed with the whole event, not only for just being accepted on this prestigious course, with amazing support & encouragement from the Pi Team, but that our workshops are set up in a similar fashion, giving us the confidence that we’re on the right lines when it comes to working with digital making, creative thinking, problem solving, communication and general “growth mindset” when creating interactive objects through prototyping & GPIO powered by a Pi (or even a MicroBit or Arduino).
If you can get yourself onto a #Picademy, we’d highly recommend that you do, we have learned a great deal from it, and we’ll be applying many lessons to our own practice & workshops in future.
A little while ago Adafruit produced a learning guide for the PyPortal that displayed tidal data https://learn.adafruit.com/pyportal-tides-viewer/overview unfortunately this was only suitable for use in the USA. I decided to see what changes were required to make a version that could use UK tidal data. In the first instance have a look at the guide and download and play with the code provided
Uk tidal data
A quick search on duck duck go revealed that the Admiralty Maritime Data Solutions, part of the UK Hydrographic office, have a freely available API.
You can register for an account here https://admiraltyapi.portal.azure-api.net/ Once signed up and logged in there is plenty of information about their API and a couple of tools to play with. As part of the process you will receive a couple of keys needed to authenticate you when requesting data.
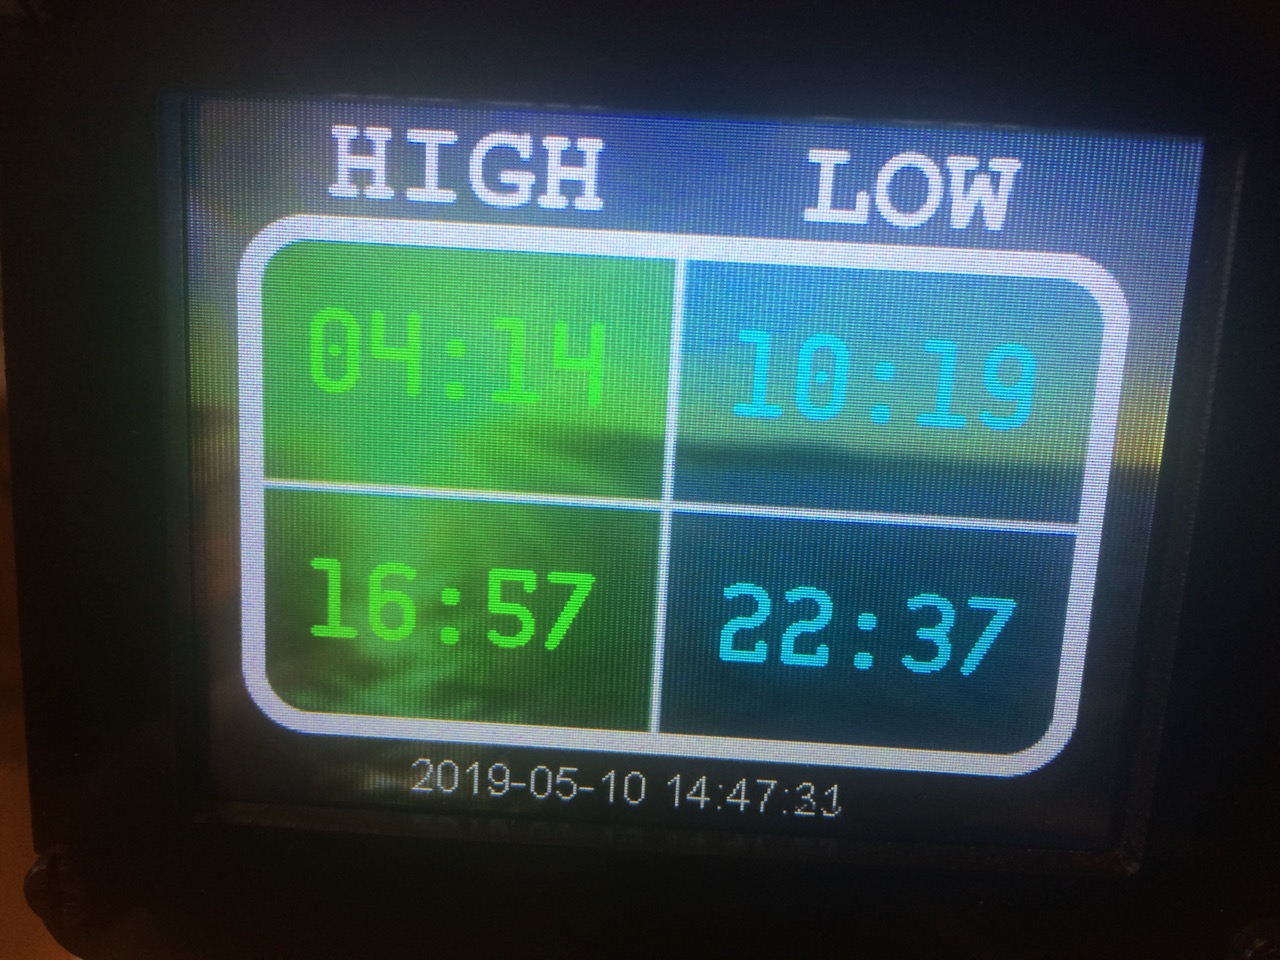
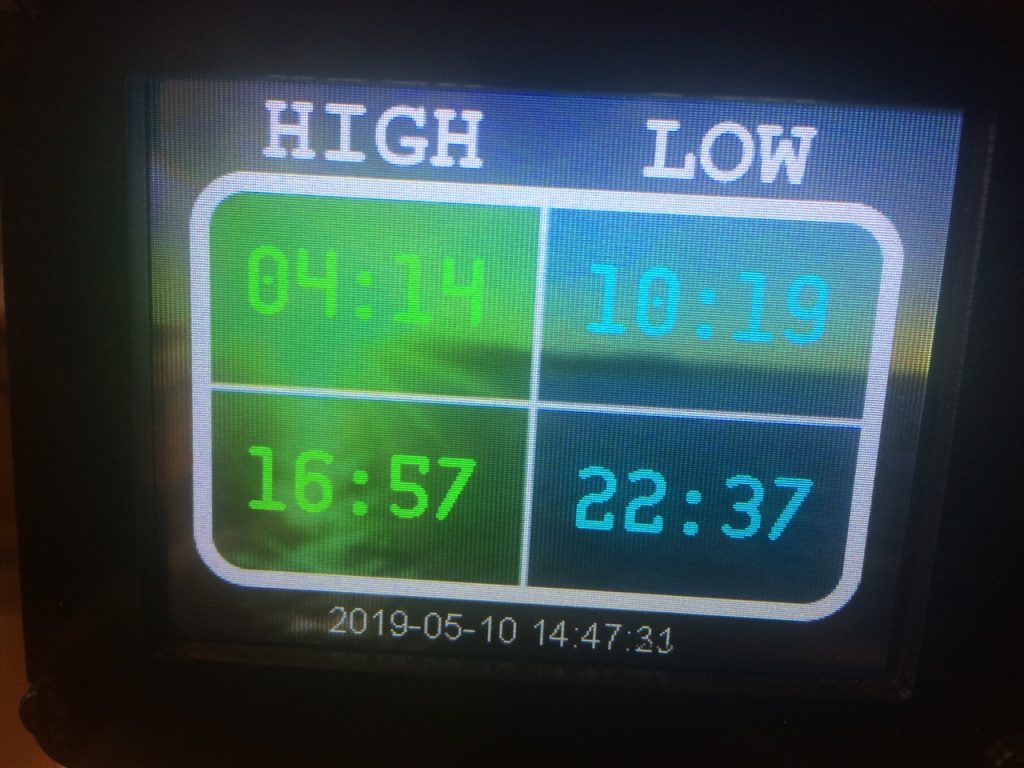
Details of high and low tide, time and height can be obtained for between one and seven days.
PyPortal
I initially looked at just displaying todays high and low tide, the same as Adafruit. Thinking it would just be a simple matter of plugging in a new API address. A number of days later!!! I had a solution. One major issue was the issue of Authentication. All examples provided by Adafruit passed any authentication strings in the URL Datasource querystring. The Admiralty use an Azure server that is set to receive authentication in a header and not the querystring. A quick check revealed that the default PyPortal library did not support this, although it was supported in libraries further down the stack.
I implemented the functionality in a forked version of PyPortal, this has now been added to PyPortal and is available in all new releases.
Code changes
A copy of my code is provided below. The STATION_ID used is for Peterhead, my nearest tidal station. You will also need to add two keys to the secrets.py file
The JSON data returned is in the form of an array so needed to be converted to a DICT format
raw_info = json.loads(raw_info)
The times returned also needed to be reformatted
for i, hi_time in enumerate(tide_info["HighWater"]):
      HI_LABELS[i].text = '{:.5}'.format(hi_time)
for i, lo_time in enumerate(tide_info["LowWater"]):
      LO_LABELS[i].text = '{:.5}'.format(lo_time)
Most of the existing code was reused
Completed code
import time
import board
from adafruit_pyportal import PyPortal
from adafruit_bitmap_font import bitmap_font
from adafruit_display_text.label import Label
import json
from secrets import secrets

#--| USER CONFIG |--------------------------
STATION_ID = "0245"   # tide location, find yours from admiralty website/
HI_COLOR   = 0x00FF00    # high tide times color
LO_COLOR   = 0x11FFFF    # low tide times color
DATE_COLOR = 0xFFFFFF    # date and time color
#-------------------------------------------

# pylint: disable=line-too-long
DATA_SOURCE = "https://admiraltyapi.azure-api.net/uktidalapi/api/V1/Stations/" + STATION_ID + "/TidalEvents?duration=1"
DATA_LOCATION = []

# determine the current working directory needed so we know where to find files
cwd = ("/"+__file__).rsplit('/', 1)[0]
pyportal = PyPortal(url=DATA_SOURCE,
                    headers={"Ocp-Apim-Subscription-Key":secrets['Ocp-Apim-Subscription-Key']},
                    json_path=DATA_LOCATION,
                    status_neopixel=board.NEOPIXEL,
                    default_bg=cwd+"/tides_bg.bmp")

# Connect to the internet and get local time
pyportal.get_local_time()

# Setup tide times font
tide_font = bitmap_font.load_font(cwd+"/fonts/cq-mono-30.bdf")
tide_font.load_glyphs(b'1234567890:')

# Setup date and time font
date_font = bitmap_font.load_font(cwd+"/fonts/Arial-12.bdf")
date_font.load_glyphs(b'1234567890-')

# Labels setup
HI_LABELS = [ Label(tide_font, text="00:00", color=HI_COLOR, x= 40, y= 80) ,
              Label(tide_font, text="00:00", color=HI_COLOR, x= 40, y=165) ]
LO_LABELS = [ Label(tide_font, text="00:00", color=LO_COLOR, x=180, y= 80) ,
              Label(tide_font, text="00:00", color=LO_COLOR, x=180, y=165) ]
DATE_LABEL = Label(date_font, text="0000-00-00 00:00:00", color=DATE_COLOR, x=75, y=228)

# Add all the labels to the display
for label in HI_LABELS + LO_LABELS + [DATE_LABEL]:
    pyportal.splash.append(label)

def get_tide_info():
    """Fetch JSON tide time info and return it."""

    # Get raw JSON data
    raw_info = pyportal.fetch()
    raw_info = json.loads(raw_info)
    # Return will be a dictionary of lists containing tide times
    new_tide_info = {"HighWater":[], "LowWater":[]}
    # Parse out the tide time info
    for info in raw_info:
        tide_type = info['EventType']
        tide_time = info['DateTime'].split("T")[1]
        new_tide_info[tide_type].append(tide_time)

    return new_tide_info

def update_display(time_info, update_tides=False):
    """Update the display with current info."""

    # Tide time info
    if update_tides:
        # out with the old
        for tide_label in HI_LABELS + LO_LABELS:
            tide_label.text = ""
        # in with the new
        for i, hi_time in enumerate(tide_info["HighWater"]):
            HI_LABELS[i].text = '{:.5}'.format(hi_time)
        for i, lo_time in enumerate(tide_info["LowWater"]):
            LO_LABELS[i].text = '{:.5}'.format(lo_time)
    # Date and time
    DATE_LABEL.text = "{:04}-{:02}-{:02} {:02}:{:02}:{:02}".format(time_info.tm_year,
                                                                   time_info.tm_mon,
                                                                   time_info.tm_mday,
                                                                   time_info.tm_hour,
                                                                   time_info.tm_min,
                                                                   time_info.tm_sec)

    board.DISPLAY.refresh_soon()

# First run update
tide_info = get_tide_info()
current_time = time.localtime()
update_display(current_time, True)
current_yday = current_time.tm_yday

# Update daily
while True:
    current_time = time.localtime()
    new_tides = False
    if current_time.tm_yday != current_yday:
        # new day, time to update
        tide_info = get_tide_info()
        new_tides = True
        current_yday = current_time.tm_yday
    update_display(current_time, new_tides)
    time.sleep(0.5)
UK tidal data
Making it graphical
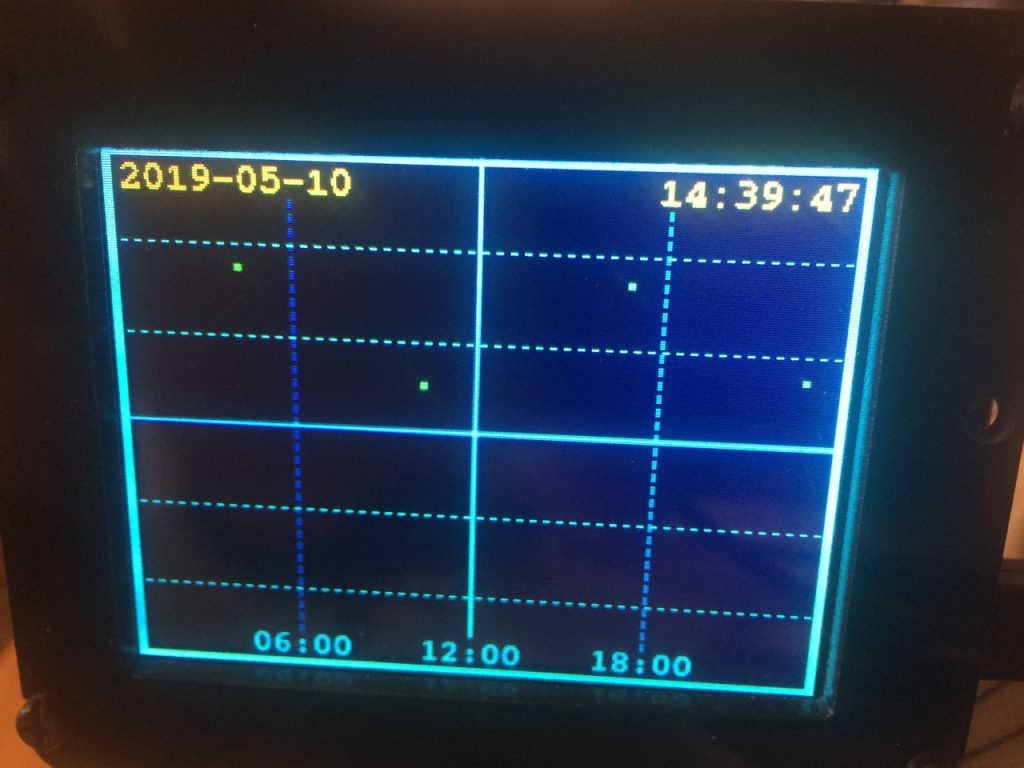
The next stage of the learning guide shows the tidal data plotted over a 24 hour period with tidal times, heights provided every six minutes. The Admiralty doesn’t provide this level of detail. They only provide the high and low water times. I decided to plot them anyway. The code is provided below.
Completed code
import time
import board
import displayio
import json
from secrets import secrets
from adafruit_pyportal import PyPortal
from adafruit_bitmap_font import bitmap_font
from adafruit_display_text.label import Label

#--| USER CONFIG |--------------------------
STATION_ID = "0245"   # tide location, find yours from admiralty website
PLOT_SIZE = 2            # tide plot thickness
PLOT_COLOR = 0x00FF55    # tide plot color
MARK_SIZE = 6            # current time marker size
MARK_COLOR = 0xFF0000    # current time marker color
DATE_COLOR = 0xE0CD1A    # date text color
TIME_COLOR = 0xE0CD1A    # time text color
VSCALE = 20              # vertical plot scale
#-------------------------------------------

# pylint: disable=line-too-long
DATA_SOURCE = "https://admiraltyapi.azure-api.net/uktidalapi/api/V1/Stations/" + STATION_ID + "/TidalEvents?duration=1"
DATA_LOCATION = []

WIDTH = board.DISPLAY.width
HEIGHT = board.DISPLAY.height

# determine the current working directory needed so we know where to find files
cwd = ("/"+__file__).rsplit('/', 1)[0]
pyportal = PyPortal(url=DATA_SOURCE,
                    headers={"Ocp-Apim-Subscription-Key":secrets['Ocp-Apim-Subscription-Key']},
                    json_path=DATA_LOCATION,
                    status_neopixel=board.NEOPIXEL,
                    default_bg=cwd+"/tides_bg_graph.bmp")

# Connect to the internet and get local time
pyportal.get_local_time()

# Setup palette used for plot
palette = displayio.Palette(3)
palette[0] = 0x0
palette[1] = PLOT_COLOR
palette[2] = MARK_COLOR
palette.make_transparent(0)

# Setup tide plot bitmap
tide_plot = displayio.Bitmap(WIDTH, HEIGHT, 3)
pyportal.splash.append(displayio.TileGrid(tide_plot, pixel_shader=palette))

# Setup font used for date and time
date_font = bitmap_font.load_font(cwd+"/fonts/mono-bold-8.bdf")
date_font.load_glyphs(b'1234567890-')

# Setup date label
date_label = Label(date_font, text="0000-00-00", color=DATE_COLOR, x=7, y=14)
pyportal.splash.append(date_label)

# Setup time label
time_label = Label(date_font, text="00:00:00", color=TIME_COLOR, x=234, y=14)
pyportal.splash.append(time_label)

# Setup current time marker
time_marker_bitmap = displayio.Bitmap(MARK_SIZE, MARK_SIZE, 3)
for pixel in range(MARK_SIZE * MARK_SIZE):
    time_marker_bitmap[pixel] = 2
time_marker = displayio.TileGrid(time_marker_bitmap, pixel_shader=palette, x=-MARK_SIZE, y=-MARK_SIZE)
pyportal.splash.append(time_marker)

def get_tide_data():
    """Fetch JSON tide data and return parsed results in a list."""

    # Get raw JSON data
    raw_data = pyportal.fetch()
    raw_data = json.loads(raw_data)
    # Results will be stored in a list that is display WIDTH long
    new_tide_data = [None]*WIDTH

    # Convert raw data to display coordinates
    for data in raw_data:
        _, t = data["DateTime"].split("T") # date and time
        t = '{:.5}'.format(t)
        h, m = t.split(":")         # hours and minutes
        v = data["Height"]               # water level
        x = round( (WIDTH - 1) * (60 * float(h) + float(m)) / 1440 )
        y = (HEIGHT // 2) - round(VSCALE * float(v))
        y = 0 if y < 0 else y
        y = HEIGHT-1 if y >= HEIGHT else y
        new_tide_data[x] = y

    return new_tide_data

def draw_data_point(x, y, size=PLOT_SIZE, color=1):
    """Draw data point on to the tide plot bitmap at (x,y)."""
    if y is None:
        return
    offset = size // 2
    for xx in range(x-offset, x+offset+1):
        for yy in range(y-offset, y+offset+1):
            try:
                tide_plot[xx, yy] = color
            except IndexError:
                pass

def draw_time_marker(time_info):
    """Draw a marker on the tide plot for the current time."""
    h = time_info.tm_hour
    m = time_info.tm_min
    x = round( (WIDTH - 1) * (60 * float(h) + float(m)) / 1440 )
    y = tide_data[x]
    if y is not None:
        x -= MARK_SIZE // 2
        y -= MARK_SIZE // 2
        time_marker.x = x
        time_marker.y = y

def update_display(time_info, update_tides=False):
    """Update the display with current info."""

    # Tide data plot
    if update_tides:
        # out with the old
        for i in range(WIDTH * HEIGHT):
            tide_plot[i] = 0
        # in with the new
        for x in range(WIDTH):
            draw_data_point(x, tide_data[x])

    # Current location marker
    draw_time_marker(time_info)

    # Date and time
    date_label.text = "{:04}-{:02}-{:02}".format(time_info.tm_year,
                                                 time_info.tm_mon,
                                                 time_info.tm_mday)
    time_label.text = "{:02}:{:02}:{:02}".format(time_info.tm_hour,
                                                 time_info.tm_min,
                                                 time_info.tm_sec)

    board.DISPLAY.refresh_soon()

# First run update
tide_data = get_tide_data()
current_time = time.localtime()
update_display(current_time, True)
current_yday = current_time.tm_yday

# Run forever
while True:
    current_time = time.localtime()
    new_tides = False
    if current_time.tm_yday != current_yday:
        # new day, time to update
        tide_data = get_tide_data()
        new_tides = True
        current_yday = current_time.tm_yday
    update_display(current_time, new_tides)
    time.sleep(0.5)
I’ve been playing with the Adafruit PyPortal recently, a 3.5 inch touchscreen display with in built functionality to quickly build Internet of Things, IoT, projects.
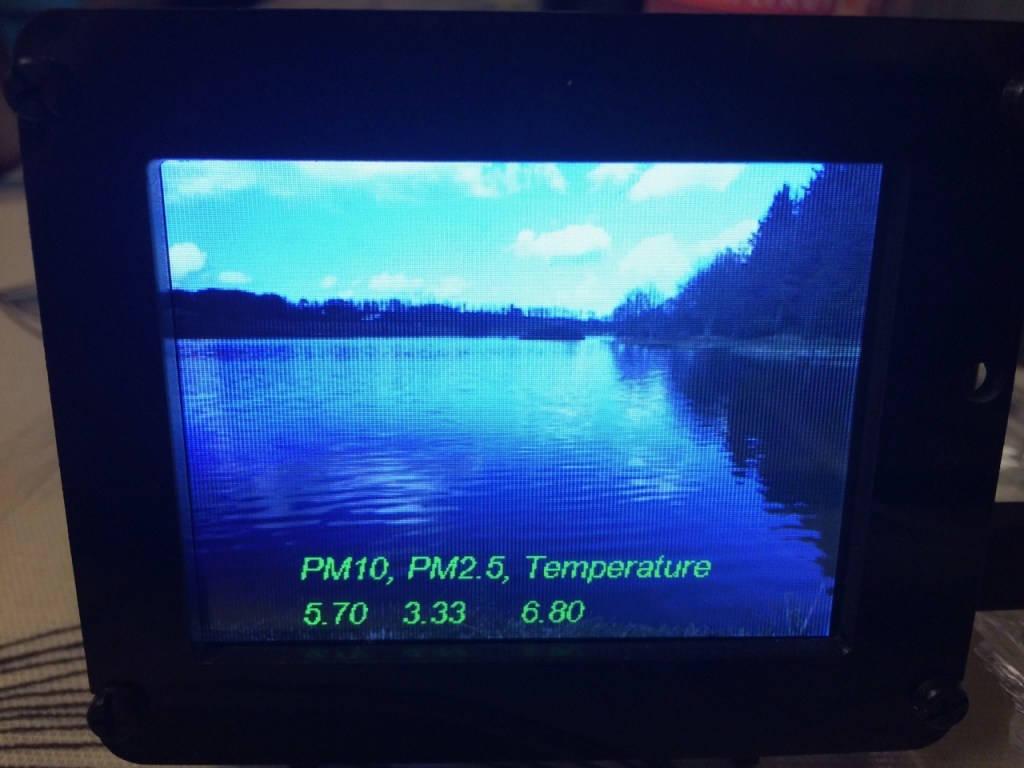
The first thing I built was a viewer for my Luftdaten Air Quality Sensor. I had connected my sensor to opensensemap as I liked the way that they displayed data. They also provide a really nice API interface.
The code I used to access my sensor is provided below
"""
This example will access the opensensemap API, grab the air quality values
pm10, pm2.5, temperature... and display it on a screen!
if you can find something that spits out JSON data, we can display it
"""
import time
import board
from adafruit_pyportal import PyPortal

# Set up where we'll be fetching data from
DATA_SOURCE = "https://api.opensensemap.org/boxes/5c6ec1ae15451500198f5abe"   # pylint: disable=line-too-long
PM10 = ["sensors",0, "lastMeasurement","value"]
PM25 = ["sensors",1, "lastMeasurement","value"]
TEMP = ["sensors",2, "lastMeasurement","value"]

# the current working directory (where this file is)
cwd = ("/"+__file__).rsplit('/', 1)[0]
# Initialize the pyportal object and let us know what data to fetch and where
# to display it
pyportal = PyPortal(url=DATA_SOURCE,
                    json_path=(PM10, PM25, TEMP),
                    status_neopixel=board.NEOPIXEL,
                    default_bg=cwd+"/IMG_6562.bmp",
                    text_font=cwd+"/fonts/Arial-ItalicMT-17.bdf",
                    text_position=((50, 225), (100, 225), (160, 225)),
                    text_color=(0x00FF00,0x00FF00,0x00FF00),
                    caption_text="PM10, PM2.5, Temperature",
                    caption_font=cwd+"/fonts/Arial-ItalicMT-17.bdf",
                    caption_position=(50,200),
                    caption_color=0x00FF00)

# track the last value so we can play a sound when it updates

while True:
    try:
        value = pyportal.fetch()
        print("Response is", value)
    except (ValueError, RuntimeError) as e:
        print("Some error occured, retrying! -", e)

    time.sleep(180)  # wait a minute before getting again
It’s all done with CircuitPython.
I quite liked the result shown below. The picture in the background is of a local lake.