A little while ago Adafruit produced a learning guide for the PyPortal that displayed tidal data https://learn.adafruit.com/pyportal-tides-viewer/overview unfortunately this was only suitable for use in the USA. I decided to see what changes were required to make a version that could use UK tidal data. In the first instance have a look at the guide and download and play with the code provided
Uk tidal data
A quick search on duck duck go revealed that the Admiralty Maritime Data Solutions, part of the UK Hydrographic office, have a freely available API.
You can register for an account here https://admiraltyapi.portal.azure-api.net/ Once signed up and logged in there is plenty of information about their API and a couple of tools to play with. As part of the process you will receive a couple of keys needed to authenticate you when requesting data.
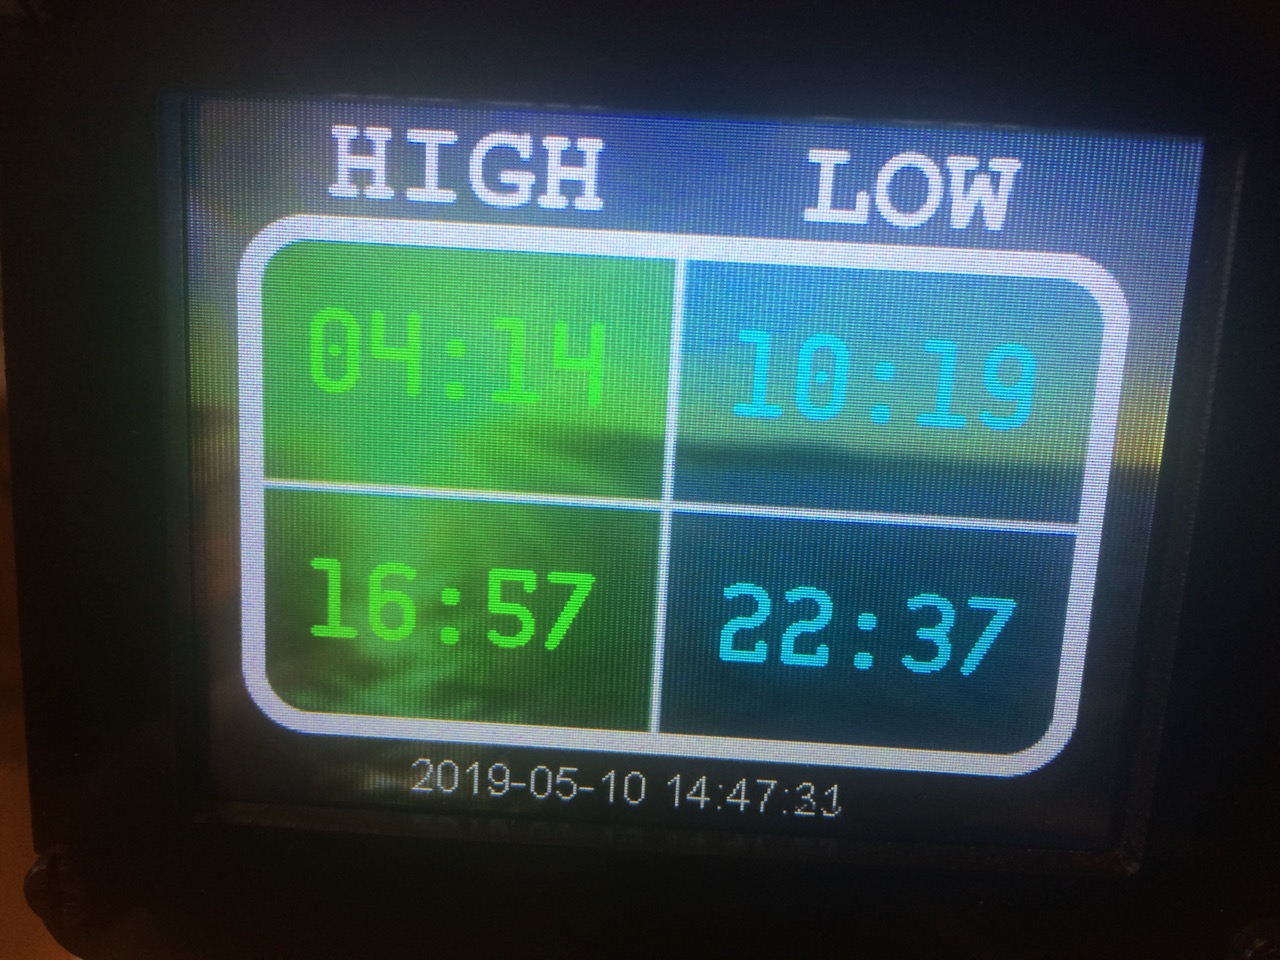
Details of high and low tide, time and height can be obtained for between one and seven days.
PyPortal
I initially looked at just displaying todays high and low tide, the same as Adafruit. Thinking it would just be a simple matter of plugging in a new API address. A number of days later!!! I had a solution. One major issue was the issue of Authentication. All examples provided by Adafruit passed any authentication strings in the URL Datasource querystring. The Admiralty use an Azure server that is set to receive authentication in a header and not the querystring. A quick check revealed that the default PyPortal library did not support this, although it was supported in libraries further down the stack.
I implemented the functionality in a forked version of PyPortal, this has now been added to PyPortal and is available in all new releases.
Code changes
A copy of my code is provided below. The STATION_ID used is for Peterhead, my nearest tidal station. You will also need to add two keys to the secrets.py file
'Ocp-Apim-Subscription-Key' : 'primary key',
'tidal_secondary' : 'secondary key',
Additional changes are in the pyportal call where we add a headers field.
headers={"Ocp-Apim-Subscription-Key":secrets['Ocp-Apim-Subscription-Key']},The JSON data returned is in the form of an array so needed to be converted to a DICT format
raw_info = json.loads(raw_info)The times returned also needed to be reformatted
for i, hi_time in enumerate(tide_info["HighWater"]):
      HI_LABELS[i].text = '{:.5}'.format(hi_time)
for i, lo_time in enumerate(tide_info["LowWater"]):
      LO_LABELS[i].text = '{:.5}'.format(lo_time)
Most of the existing code was reused
Completed code
import time
import board
from adafruit_pyportal import PyPortal
from adafruit_bitmap_font import bitmap_font
from adafruit_display_text.label import Label
import json
from secrets import secrets

#--| USER CONFIG |--------------------------
STATION_ID = "0245"   # tide location, find yours from admiralty website/
HI_COLOR   = 0x00FF00    # high tide times color
LO_COLOR   = 0x11FFFF    # low tide times color
DATE_COLOR = 0xFFFFFF    # date and time color
#-------------------------------------------

# pylint: disable=line-too-long
DATA_SOURCE = "https://admiraltyapi.azure-api.net/uktidalapi/api/V1/Stations/" + STATION_ID + "/TidalEvents?duration=1"
DATA_LOCATION = []

# determine the current working directory needed so we know where to find files
cwd = ("/"+__file__).rsplit('/', 1)[0]
pyportal = PyPortal(url=DATA_SOURCE,
                    headers={"Ocp-Apim-Subscription-Key":secrets['Ocp-Apim-Subscription-Key']},
                    json_path=DATA_LOCATION,
                    status_neopixel=board.NEOPIXEL,
                    default_bg=cwd+"/tides_bg.bmp")

# Connect to the internet and get local time
pyportal.get_local_time()

# Setup tide times font
tide_font = bitmap_font.load_font(cwd+"/fonts/cq-mono-30.bdf")
tide_font.load_glyphs(b'1234567890:')

# Setup date and time font
date_font = bitmap_font.load_font(cwd+"/fonts/Arial-12.bdf")
date_font.load_glyphs(b'1234567890-')

# Labels setup
HI_LABELS = [ Label(tide_font, text="00:00", color=HI_COLOR, x= 40, y= 80) ,
              Label(tide_font, text="00:00", color=HI_COLOR, x= 40, y=165) ]
LO_LABELS = [ Label(tide_font, text="00:00", color=LO_COLOR, x=180, y= 80) ,
              Label(tide_font, text="00:00", color=LO_COLOR, x=180, y=165) ]
DATE_LABEL = Label(date_font, text="0000-00-00 00:00:00", color=DATE_COLOR, x=75, y=228)

# Add all the labels to the display
for label in HI_LABELS + LO_LABELS + [DATE_LABEL]:
    pyportal.splash.append(label)

def get_tide_info():
    """Fetch JSON tide time info and return it."""

    # Get raw JSON data
    raw_info = pyportal.fetch()
    raw_info = json.loads(raw_info)
    # Return will be a dictionary of lists containing tide times
    new_tide_info = {"HighWater":[], "LowWater":[]}
    # Parse out the tide time info
    for info in raw_info:
        tide_type = info['EventType']
        tide_time = info['DateTime'].split("T")[1]
        new_tide_info[tide_type].append(tide_time)

    return new_tide_info

def update_display(time_info, update_tides=False):
    """Update the display with current info."""

    # Tide time info
    if update_tides:
        # out with the old
        for tide_label in HI_LABELS + LO_LABELS:
            tide_label.text = ""
        # in with the new
        for i, hi_time in enumerate(tide_info["HighWater"]):
            HI_LABELS[i].text = '{:.5}'.format(hi_time)
        for i, lo_time in enumerate(tide_info["LowWater"]):
            LO_LABELS[i].text = '{:.5}'.format(lo_time)
    # Date and time
    DATE_LABEL.text = "{:04}-{:02}-{:02} {:02}:{:02}:{:02}".format(time_info.tm_year,
                                                                   time_info.tm_mon,
                                                                   time_info.tm_mday,
                                                                   time_info.tm_hour,
                                                                   time_info.tm_min,
                                                                   time_info.tm_sec)

    board.DISPLAY.refresh_soon()

# First run update
tide_info = get_tide_info()
current_time = time.localtime()
update_display(current_time, True)
current_yday = current_time.tm_yday

# Update daily
while True:
    current_time = time.localtime()
    new_tides = False
    if current_time.tm_yday != current_yday:
        # new day, time to update
        tide_info = get_tide_info()
        new_tides = True
        current_yday = current_time.tm_yday
    update_display(current_time, new_tides)
    time.sleep(0.5)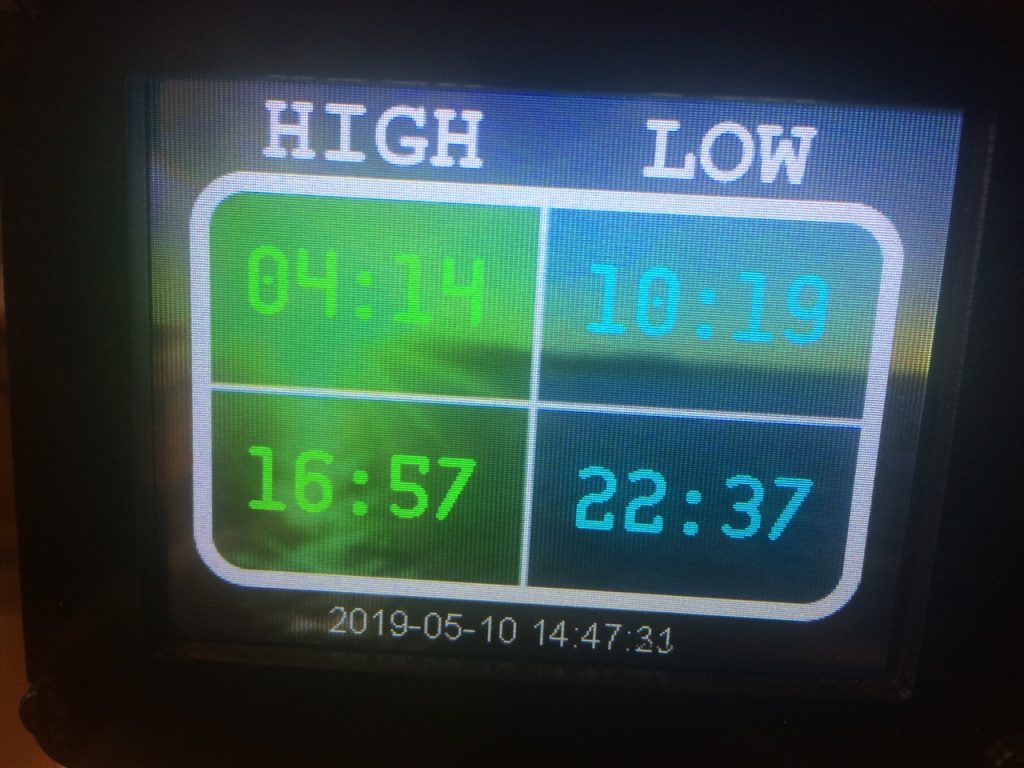
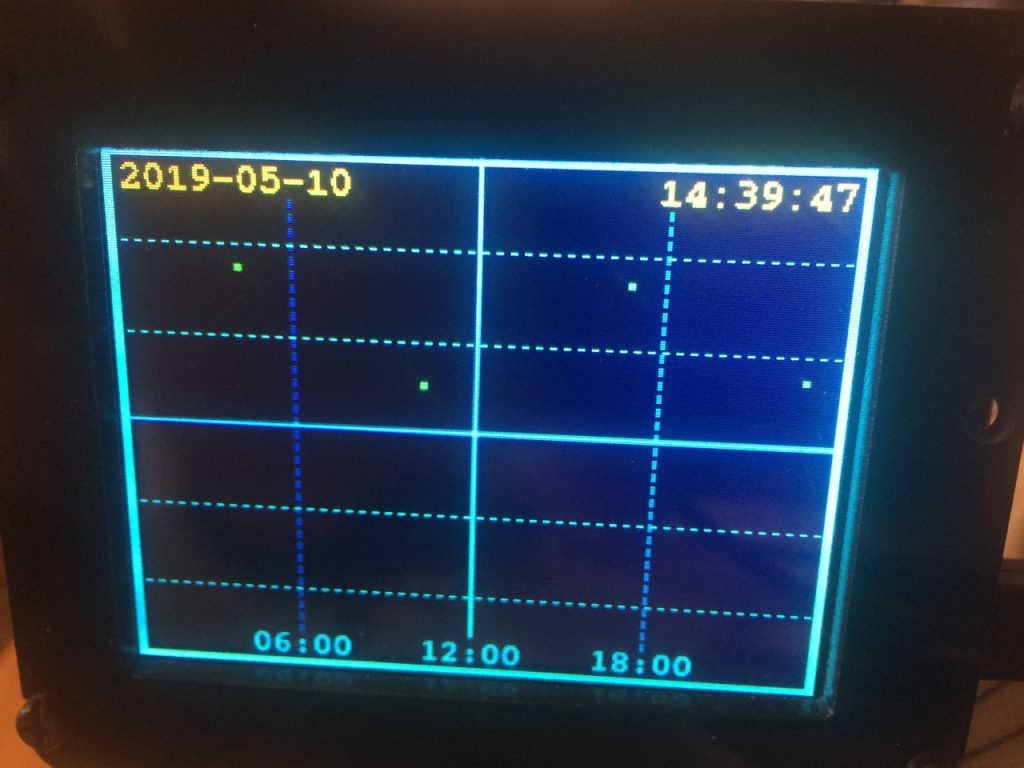
Making it graphical
The next stage of the learning guide shows the tidal data plotted over a 24 hour period with tidal times, heights provided every six minutes. The Admiralty doesn’t provide this level of detail. They only provide the high and low water times. I decided to plot them anyway. The code is provided below.
Completed code
import time
import board
import displayio
import json
from secrets import secrets
from adafruit_pyportal import PyPortal
from adafruit_bitmap_font import bitmap_font
from adafruit_display_text.label import Label

#--| USER CONFIG |--------------------------
STATION_ID = "0245"   # tide location, find yours from admiralty website
PLOT_SIZE = 2            # tide plot thickness
PLOT_COLOR = 0x00FF55    # tide plot color
MARK_SIZE = 6            # current time marker size
MARK_COLOR = 0xFF0000    # current time marker color
DATE_COLOR = 0xE0CD1A    # date text color
TIME_COLOR = 0xE0CD1A    # time text color
VSCALE = 20              # vertical plot scale
#-------------------------------------------

# pylint: disable=line-too-long
DATA_SOURCE = "https://admiraltyapi.azure-api.net/uktidalapi/api/V1/Stations/" + STATION_ID + "/TidalEvents?duration=1"
DATA_LOCATION = []

WIDTH = board.DISPLAY.width
HEIGHT = board.DISPLAY.height

# determine the current working directory needed so we know where to find files
cwd = ("/"+__file__).rsplit('/', 1)[0]
pyportal = PyPortal(url=DATA_SOURCE,
                    headers={"Ocp-Apim-Subscription-Key":secrets['Ocp-Apim-Subscription-Key']},
                    json_path=DATA_LOCATION,
                    status_neopixel=board.NEOPIXEL,
                    default_bg=cwd+"/tides_bg_graph.bmp")

# Connect to the internet and get local time
pyportal.get_local_time()

# Setup palette used for plot
palette = displayio.Palette(3)
palette[0] = 0x0
palette[1] = PLOT_COLOR
palette[2] = MARK_COLOR
palette.make_transparent(0)

# Setup tide plot bitmap
tide_plot = displayio.Bitmap(WIDTH, HEIGHT, 3)
pyportal.splash.append(displayio.TileGrid(tide_plot, pixel_shader=palette))

# Setup font used for date and time
date_font = bitmap_font.load_font(cwd+"/fonts/mono-bold-8.bdf")
date_font.load_glyphs(b'1234567890-')

# Setup date label
date_label = Label(date_font, text="0000-00-00", color=DATE_COLOR, x=7, y=14)
pyportal.splash.append(date_label)

# Setup time label
time_label = Label(date_font, text="00:00:00", color=TIME_COLOR, x=234, y=14)
pyportal.splash.append(time_label)

# Setup current time marker
time_marker_bitmap = displayio.Bitmap(MARK_SIZE, MARK_SIZE, 3)
for pixel in range(MARK_SIZE * MARK_SIZE):
    time_marker_bitmap[pixel] = 2
time_marker = displayio.TileGrid(time_marker_bitmap, pixel_shader=palette, x=-MARK_SIZE, y=-MARK_SIZE)
pyportal.splash.append(time_marker)

def get_tide_data():
    """Fetch JSON tide data and return parsed results in a list."""

    # Get raw JSON data
    raw_data = pyportal.fetch()
    raw_data = json.loads(raw_data)
    # Results will be stored in a list that is display WIDTH long
    new_tide_data = [None]*WIDTH

    # Convert raw data to display coordinates
    for data in raw_data:
        _, t = data["DateTime"].split("T") # date and time
        t = '{:.5}'.format(t)
        h, m = t.split(":")         # hours and minutes
        v = data["Height"]               # water level
        x = round( (WIDTH - 1) * (60 * float(h) + float(m)) / 1440 )
        y = (HEIGHT // 2) - round(VSCALE * float(v))
        y = 0 if y < 0 else y
        y = HEIGHT-1 if y >= HEIGHT else y
        new_tide_data[x] = y

    return new_tide_data

def draw_data_point(x, y, size=PLOT_SIZE, color=1):
    """Draw data point on to the tide plot bitmap at (x,y)."""
    if y is None:
        return
    offset = size // 2
    for xx in range(x-offset, x+offset+1):
        for yy in range(y-offset, y+offset+1):
            try:
                tide_plot[xx, yy] = color
            except IndexError:
                pass

def draw_time_marker(time_info):
    """Draw a marker on the tide plot for the current time."""
    h = time_info.tm_hour
    m = time_info.tm_min
    x = round( (WIDTH - 1) * (60 * float(h) + float(m)) / 1440 )
    y = tide_data[x]
    if y is not None:
        x -= MARK_SIZE // 2
        y -= MARK_SIZE // 2
        time_marker.x = x
        time_marker.y = y

def update_display(time_info, update_tides=False):
    """Update the display with current info."""

    # Tide data plot
    if update_tides:
        # out with the old
        for i in range(WIDTH * HEIGHT):
            tide_plot[i] = 0
        # in with the new
        for x in range(WIDTH):
            draw_data_point(x, tide_data[x])

    # Current location marker
    draw_time_marker(time_info)

    # Date and time
    date_label.text = "{:04}-{:02}-{:02}".format(time_info.tm_year,
                                                 time_info.tm_mon,
                                                 time_info.tm_mday)
    time_label.text = "{:02}:{:02}:{:02}".format(time_info.tm_hour,
                                                 time_info.tm_min,
                                                 time_info.tm_sec)

    board.DISPLAY.refresh_soon()

# First run update
tide_data = get_tide_data()
current_time = time.localtime()
update_display(current_time, True)
current_yday = current_time.tm_yday

# Run forever
while True:
    current_time = time.localtime()
    new_tides = False
    if current_time.tm_yday != current_yday:
        # new day, time to update
        tide_data = get_tide_data()
        new_tides = True
        current_yday = current_time.tm_yday
    update_display(current_time, new_tides)
    time.sleep(0.5)